How Do You See What Your Agent Is Actually Doing in Production?
It passed all our tests but still does unexpected things with real users. How do we see what it is actually doing?
8 min · Updated June 2026
Part 3 of 6 — “Governing AI Agents in the Enterprise: A Practical Architecture Guide”
This article covers the Telemetry discipline: how to make every agent run observable in production, and how to manage prompts as governed artifacts rather than freeform strings.
3.1 - It passed all our tests but still does weird things with real users. How do we see what it is actually doing in production?
The pattern: Distributed tracing for agents.
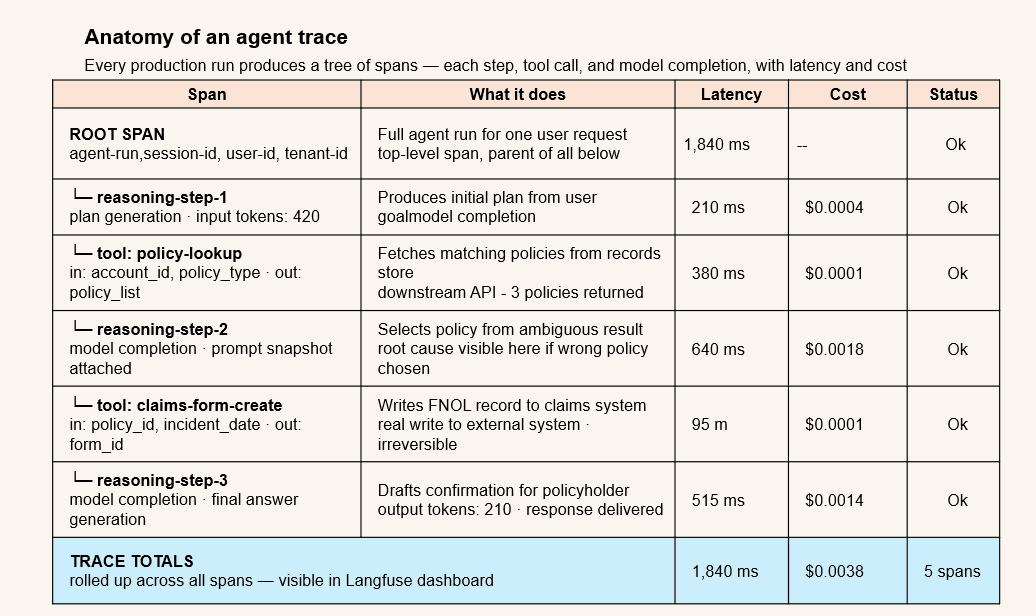
No pre-production test suite covers every real-world input. Production behavior must be observable: every agent run should produce a structured trace — a tree of spans showing each reasoning step, each tool call with its inputs and outputs, each model completion, plus latency and cost. This is the same idea as distributed tracing in microservices, applied to an agent’s internal steps.
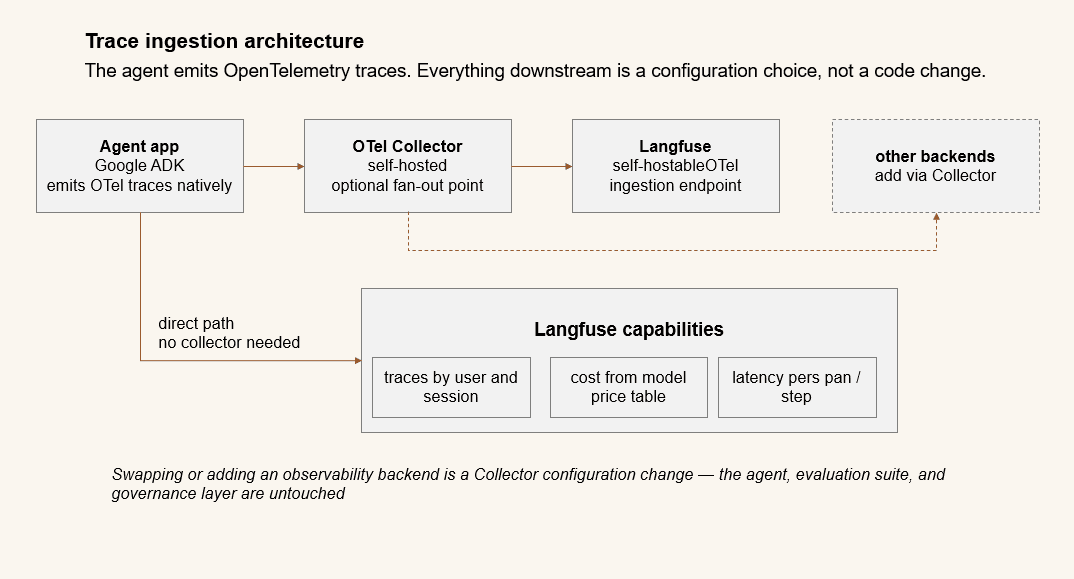
A framework like Google ADK natively emits OpenTelemetry traces using standard GenAI semantic conventions. An observability platform like Langfuse exposes an OpenTelemetry ingestion endpoint and can be self-hosted on entirely open-source infrastructure. Point the agent’s trace exporter at Langfuse — directly, or via a self-hosted OpenTelemetry Collector — and every production run becomes a navigable trace. The platform groups traces by user and session, calculates cost from a configurable model price table, and renders latency breakdowns.
One practical detail: raw tool-call attributes from the agent framework do not always map cleanly into the observability platform’s top-level fields. The fix is to use dedicated instrumentation libraries and lightweight decorators on critical tools, and to propagate identifiers (user, session, tenant) across child spans so every step is attributable to the right context.
# AUTH=$(echo -n "pk-lf-...:sk-lf-..." | base64)
export OTEL_EXPORTER_OTLP_ENDPOINT="https://cloud.langfuse.com/api/public/otel"
export OTEL_EXPORTER_OTLP_HEADERS="Authorization=Basic ${AUTH},x-langfuse-ingestion-version=4"from opentelemetry import trace
tracer = trace.get_tracer("agent")
def instrument(fn):
def wrapper(*args, **kw):
with tracer.start_as_current_span(fn.__name__) as span:
span.set_attribute("user.id", ctx.user_id)
span.set_attribute("session.id", ctx.session_id)
span.set_attribute("tenant.id", ctx.tenant_id)
return fn(*args, **kw)
return wrapper
@instrument
def policy_lookup(policy_id): ... # the ambiguous-multi-policy tool from the insurance exampleWhat a good trace must contain
- ✓User inputs — the exact text or data the agent received
- ✓Tool calls with full arguments — not just the tool name
- ✓Model completions — what the LLM actually returned at each step
- ✓Latency per span — so bottlenecks are attributable to a specific tool or step
- ✓Cost per span — broken down by model call, not just aggregate per run
- ✓Propagated identifiers — user ID, session ID, tenant ID on every child span
Traces are not your audit log
Real-world examples
Insurance -- first-notice-of-loss claims intake agent
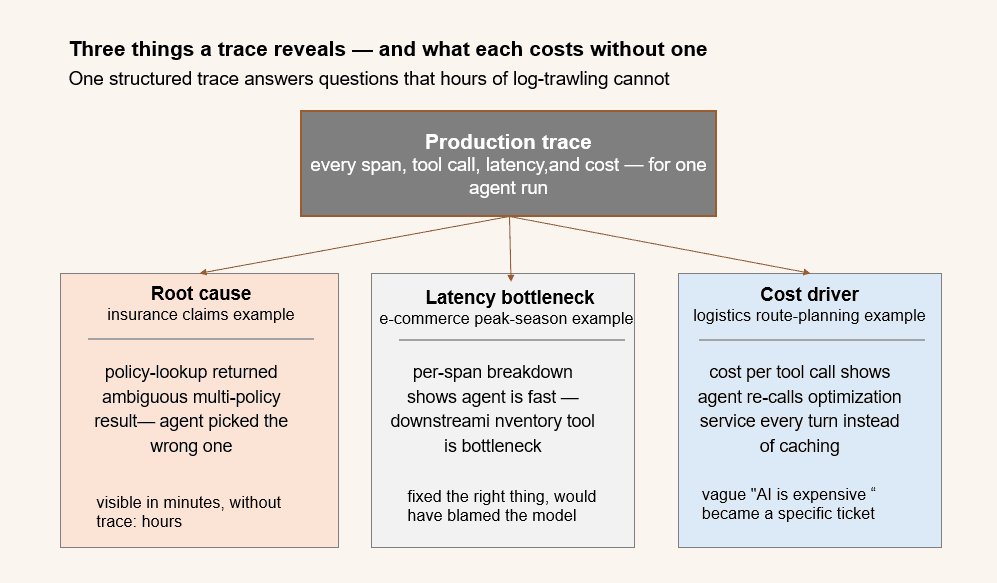
A customer reports the agent “got confused.” With tracing, the adjuster opens the exact trace: the agent called the policy-lookup tool, received an ambiguous multi-policy result, and picked the wrong policy. Root cause is visible in minutes — and it immediately becomes a new regression test case.
E-commerce -- peak-season order management agent
During a sales event, average response time doubles. The latency breakdown shows the agent itself is fast, but one downstream inventory tool is the bottleneck. Without per-span tracing, the team would have blamed the model and fixed the wrong thing.
Logistics -- route-planning agent
Cost per agent run is creeping up. The cost dashboard, broken down per tool and per step, reveals the agent is re-calling an expensive optimization service on every turn instead of caching the result. A visible, attributable cost line turns a vague “AI is expensive” complaint into a specific, fixable engineering ticket.
3.2 - How do we change prompts safely -- roll out, roll back, and control who can touch them?
The pattern: Prompt management as a release-controlled artifact.
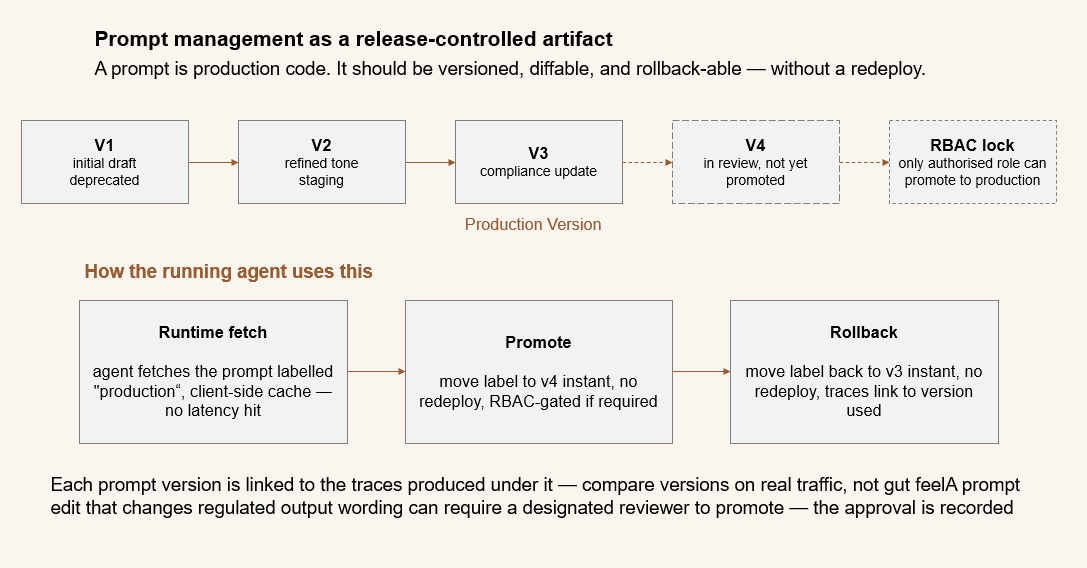
A prompt is effectively production code: it determines behavior. Yet most teams edit prompts as inline string literals, with no version history, no review process, and no way to roll back. A prompt should be a versioned, governed artifact with controlled deployment — decoupled from the application’s release cycle so a prompt fix does not require a full redeploy.
A platform like Langfuse provides prompt management: prompts are versioned, every change is diffable, and versions carry labels such as production and staging. The running agent fetches the prompt labelled production at runtime — with client-side caching, so there is no latency penalty. Promoting a new version is a label change; rolling back is moving the label to the previous version — instant, no redeploy needed.
Sensitive labels can be RBAC-protected so only authorized roles can promote a prompt to production. Because each prompt version links to the traces produced under it, you can compare versions on real traffic — not just gut feel.
from langfuse import get_client
langfuse = get_client()

# Agent fetches the PRODUCTION-labelled version at runtime; cache_ttl avoids latency
prompt = langfuse.get_prompt("triage", label="production", cache_ttl_seconds=60)
compiled = prompt.compile(customer_name="Ada", tier="gold")

# 'Promote' and 'rollback' are label moves in the UI/SDK — no redeploy needed:
# staging -> production (promote) | production -> previous version (rollback)# Pull the lowest-scoring production traces and surface them for curation
traces = langfuse.api.trace.list(order_by="score.asc", limit=20)
for tr in traces.data:
langfuse.create_dataset_item(
dataset_name="golden-regressions",
input=tr.input,
expected_output=tr.output, # review and edit expected_output before running evals
)
# This dataset is what DeepEval reads in the Part 2 CI gate — the loop is closed.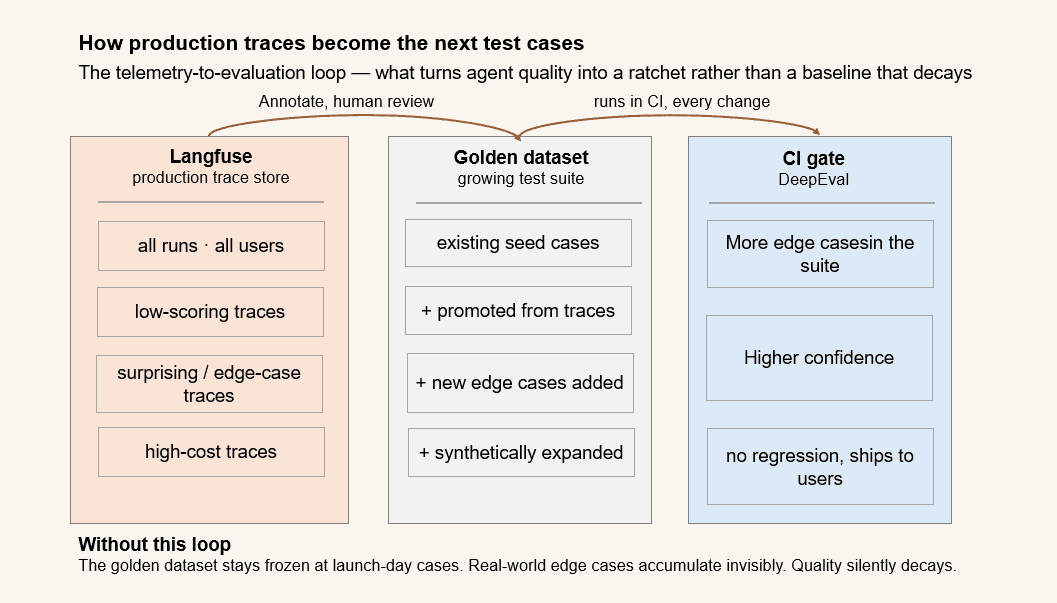
Real-world examples
Legal -- contract-review agent
A prompt change subtly alters how the agent flags indemnification clauses. Because the prior version is one label-move away, the practice group lead rolls back instantly when a partner reports the change — no emergency deployment, no downtime — while the team investigates.
Financial services -- investment-research summarization agent
Compliance requires that only a designated reviewer can put a new prompt into production, because prompt wording affects whether output reads as regulated advice. RBAC-protected production labels enforce this: analysts can draft and test prompts under staging, but promotion is gated to the compliance reviewer, and the approval is recorded.
Pharmaceuticals -- medical-information agent
A new prompt version rolls out to 100% of traffic and, within an hour, trace-linked metrics show a rise in unsupported claims. The team rolls back by moving the label, then uses the version-to-trace links to diagnose exactly which instruction caused the drift.
Libraries & frameworks
| Library / Framework | Role |
|---|---|
| Langfuse | Trace store, prompt management (labels/versions), datasets, and online eval. |
| OpenTelemetry SDK + OTLP exporter | Emit and ship spans; opentelemetry-instrumentation covers popular frameworks with zero-code auto-instrumentation. |
| OpenTelemetry Collector | Optional fan-out point (Part 6) — sits between your agent and the backend, making the backend swappable without code changes. |
| OpenLLMetry (Traceloop) / OpenInference (Arize) | Prebuilt GenAI span conventions — use instead of hand-rolling decorators when you want framework coverage out of the box. |
| Grafana Tempo · Jaeger · Arize Phoenix · Honeycomb | Alternative backends — same OTel wire format, different viewer. The tracing pattern is backend-agnostic. |
What to carry forward
Telemetry gives you two things that nothing else can:
- Reconstructability.When something goes wrong, you can see exactly what happened — which tools were called, in what order, with what arguments, and what the model saw and decided at each step.
- Continuous input for improvement. The traces you collect in production are raw material for your evaluation suite. The low-scoring, surprising, or expensive runs should become your next golden test cases. This is the feedback loop that makes agent quality a ratchet rather than a baseline that silently decays.
Evaluation and telemetry are largely detectivecapabilities — they tell you what happened or what could go wrong. The next two articles address prevention: how to stop agents from taking dangerous or unauthorized actions in the first place.